Can You Read the Bottom Line? The Story of Herman Snellen and the Chart That Standardized Human Vision
Walk into any optometrist's office in the world today and you will find it: a white chart on the wall, rows of black letters descending from a large E at the top to a barely legible line of tiny characters at the bottom. You will be asked to cover one eye and read as far down as you can. The result — expressed as a fraction like 20/20 or 20/40 — will tell your doctor, in a precise and universally understood language, exactly how well you see.
That chart, and that language, were invented by one man: Herman Snellen, a Dutch ophthalmologist working in Utrecht in 1862. In creating his visual acuity test, Snellen did something that seems simple in retrospect but had eluded medicine for centuries: he made the measurement of human vision objective.
Before Snellen: The Subjective World of Vision Testing
For most of medical history, assessing a patient's vision was a matter of clinical impression. Physicians would hold up objects — a coin, a printed page, a finger — at varying distances and ask whether the patient could see them. The results depended entirely on the examiner's judgment, the lighting conditions, the size of the object, and the patient's willingness to cooperate. There was no standard, no number, no way to compare one patient's vision to another's, or to track whether a patient's sight was improving or deteriorating over time.
By the mid-nineteenth century, as ophthalmology was emerging as a distinct medical specialty — aided enormously by Hermann von Helmholtz's invention of the ophthalmoscope in 1851 — the need for a standardized vision test was becoming urgent. Surgeons needed to assess candidates for military service. Opticians needed to prescribe corrective lenses with precision. Physicians needed to document the progression of eye disease. The field was ready for a solution.
Herman Snellen and the Birth of the Optotype
Herman Snellen (1834–1908) was born in Zeist, in the Netherlands, and trained in medicine at Utrecht, where he would spend his entire career. He worked under Franciscus Donders, one of the founding figures of modern ophthalmology, who had been systematically studying the optics of the human eye and the nature of refractive errors — myopia, hyperopia, astigmatism — with a rigour that was transforming the field.
It was in this environment of scientific precision that Snellen developed his chart. The key insight was geometric. Snellen reasoned that a person with normal vision should be able to distinguish two points separated by an angle of one minute of arc — one sixtieth of a degree. He designed his letters — the optotypes — so that each character, when viewed from its designated distance, subtended exactly five minutes of arc in height, with each stroke of the letter subtending one minute of arc. A person who could read the standard line at the standard distance had, by definition, normal vision.
The result was a chart that was not merely a collection of letters but a precisely calibrated optical instrument. Each row corresponded to a specific distance at which a person with normal vision should be able to read it. The largest letter at the top — the famous E — was designed to be readable at 60 metres by someone with normal sight. The smaller rows corresponded to 36 metres, 24 metres, 18 metres, 12 metres, 9 metres, and 6 metres. A patient tested at 6 metres who could only read the 12-metre line had vision of 6/12 — or, in the American convention that would later become standard, 20/40.
The Logic of 20/20
The fraction that Snellen's system produces is elegantly simple. The numerator is the distance at which the patient is tested (6 metres in Europe, 20 feet in the United States). The denominator is the distance at which a person with normal vision could read the same line. A result of 20/20 — or 6/6 — means that the patient sees at 20 feet what a person with normal vision sees at 20 feet. A result of 20/200 means that the patient must stand at 20 feet to see what a normal-sighted person can see at 200 feet — the threshold for legal blindness in many jurisdictions.
The elegance of this system is that it requires no subjective judgment from the examiner. The chart is the standard. The distance is fixed. The result is a number that any physician anywhere in the world can interpret, compare, and record.
The Design of the Letters
Snellen's choice of letters was not arbitrary. He needed characters that were visually distinct from one another, that could be constructed on a precise geometric grid, and that would not give an unfair advantage to patients who might guess a letter from partial information. His original optotypes were constructed on a 5×5 grid, with each stroke occupying exactly one unit of the grid — ensuring that the critical detail of each letter subtended exactly one minute of arc at the designated distance.
Over the decades, the specific letters used in Snellen charts have been refined and standardized, and alternative designs — including the Landolt C ring and the ETDRS chart used in clinical research — have been developed to address various limitations of the original. But the fundamental principle that Snellen established in 1862 remains unchanged: vision is measured by the smallest optotype that can be resolved at a standard distance, and the result is expressed as a fraction that places the patient's performance in relation to a defined norm.
A Global Standard
The adoption of Snellen's chart was remarkably rapid. Within a decade of its publication, it had been translated into multiple languages and was in use across Europe and North America. Military services adopted it to screen recruits. Railway companies used it to certify the vision of engine drivers. Schools began testing children's eyesight with it. The chart moved from the ophthalmologist's consulting room to the school nurse's office, the army barracks, and the driver's licence bureau.
Today, more than 160 years after Snellen published his chart in Utrecht, some version of it hangs in virtually every optometrist's and ophthalmologist's office in the world. The specific design has been updated, the lighting standardized, the letter selection refined — but the underlying logic is Snellen's: a precisely calibrated instrument for translating the subjective experience of sight into an objective, reproducible number.
The Legacy of a Simple Idea
What Snellen achieved in 1862 was something that medicine has always struggled to do: he gave physicians a shared language for a phenomenon that is, by its nature, private and subjective. Vision is what each of us experiences alone, behind our own eyes. Snellen found a way to measure it, compare it, and communicate it — to make the invisible legible.
There is something quietly remarkable about the fact that the instrument he designed to do this — a chart of letters on a white background — has remained essentially unchanged for a century and a half. In an era of retinal imaging, optical coherence tomography, and wavefront aberrometry, the Snellen chart endures. It is one of the most successful diagnostic instruments in the history of medicine, and one of the simplest.
The next time you sit in an optometrist's chair and read the bottom line, you are participating in a ritual that Herman Snellen designed in Utrecht in 1862 — a small act of measurement that connects you to one of the great standardization projects of Victorian science.
Further Reading
- Snellen, H. (1862). Probebuchstaben zur Bestimmung der Sehschärfe. Utrecht: Van de Weijer.
- Donders, F. C. (1864). On the Anomalies of Accommodation and Refraction of the Eye. London: New Sydenham Society.
- Helmholtz, H. von (1851). Beschreibung eines Augen-Spiegels. Berlin: Förstner.
- Bennett, A. G. (1965). Ophthalmic test types: A review of previous work and discussions on some controversial questions. British Journal of Physiological Optics, 22(4), 238–271.
- Colenbrander, A. (2008). The historical roots of the 20/20 standard. Optometry and Vision Science, 85(11), 1043–1048.
- Atchison, D. A., & Charman, W. N. (2010). Thomas Young's contribution to visual optics: The Bakerian Lecture 'On the mechanism of the eye'. Journal of Vision, 10(12), 1–16.

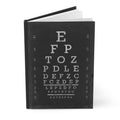
The Snellen Eye Chart Journal from LeBonJournal features Herman Snellen's 1862 visual acuity chart on the front cover, rendered in a bold black-and-white negative interpretation. 150 lined pages, hardcover, 5.5 × 8.5 inches. Explore the journal →